Catch JavaScript errors before your users do
Add one `<script>` tag to your page and Uptime Assure automatically captures JS exceptions, failed network requests, and unhandled rejections — and reports them straight to your dashboard.
Everything you need
Purpose-built features that make console error monitoring reliable, fast, and easy to act on.
JS exception tracking
Captures uncaught JavaScript exceptions and unhandled promise rejections — the silent errors that break user workflows.
Failed network requests
Detects failed fetch and XHR requests (4xx/5xx) logged to the console — so broken API calls don't go unnoticed.
Error grouping & trends
Identical errors are deduplicated into groups with occurrence counts and daily sparklines so you can prioritise what matters.
One script tag to install
Copy a single <script src="..."> tag from your monitor settings and paste it into your page's <head>. No build step, no SDK.
How it works
One script tag — up and running in under 2 minutes.
Enable Console Monitoring on your monitor
Toggle "Console Monitoring" when adding or editing an HTTP/HTTPS monitor, then copy the generated script tag from monitor settings.
Add the script tag to your page
Paste the one-liner <script src="..."> into your page's <head>. The snippet intercepts errors and beacons them to Uptime Assure — nothing else required.
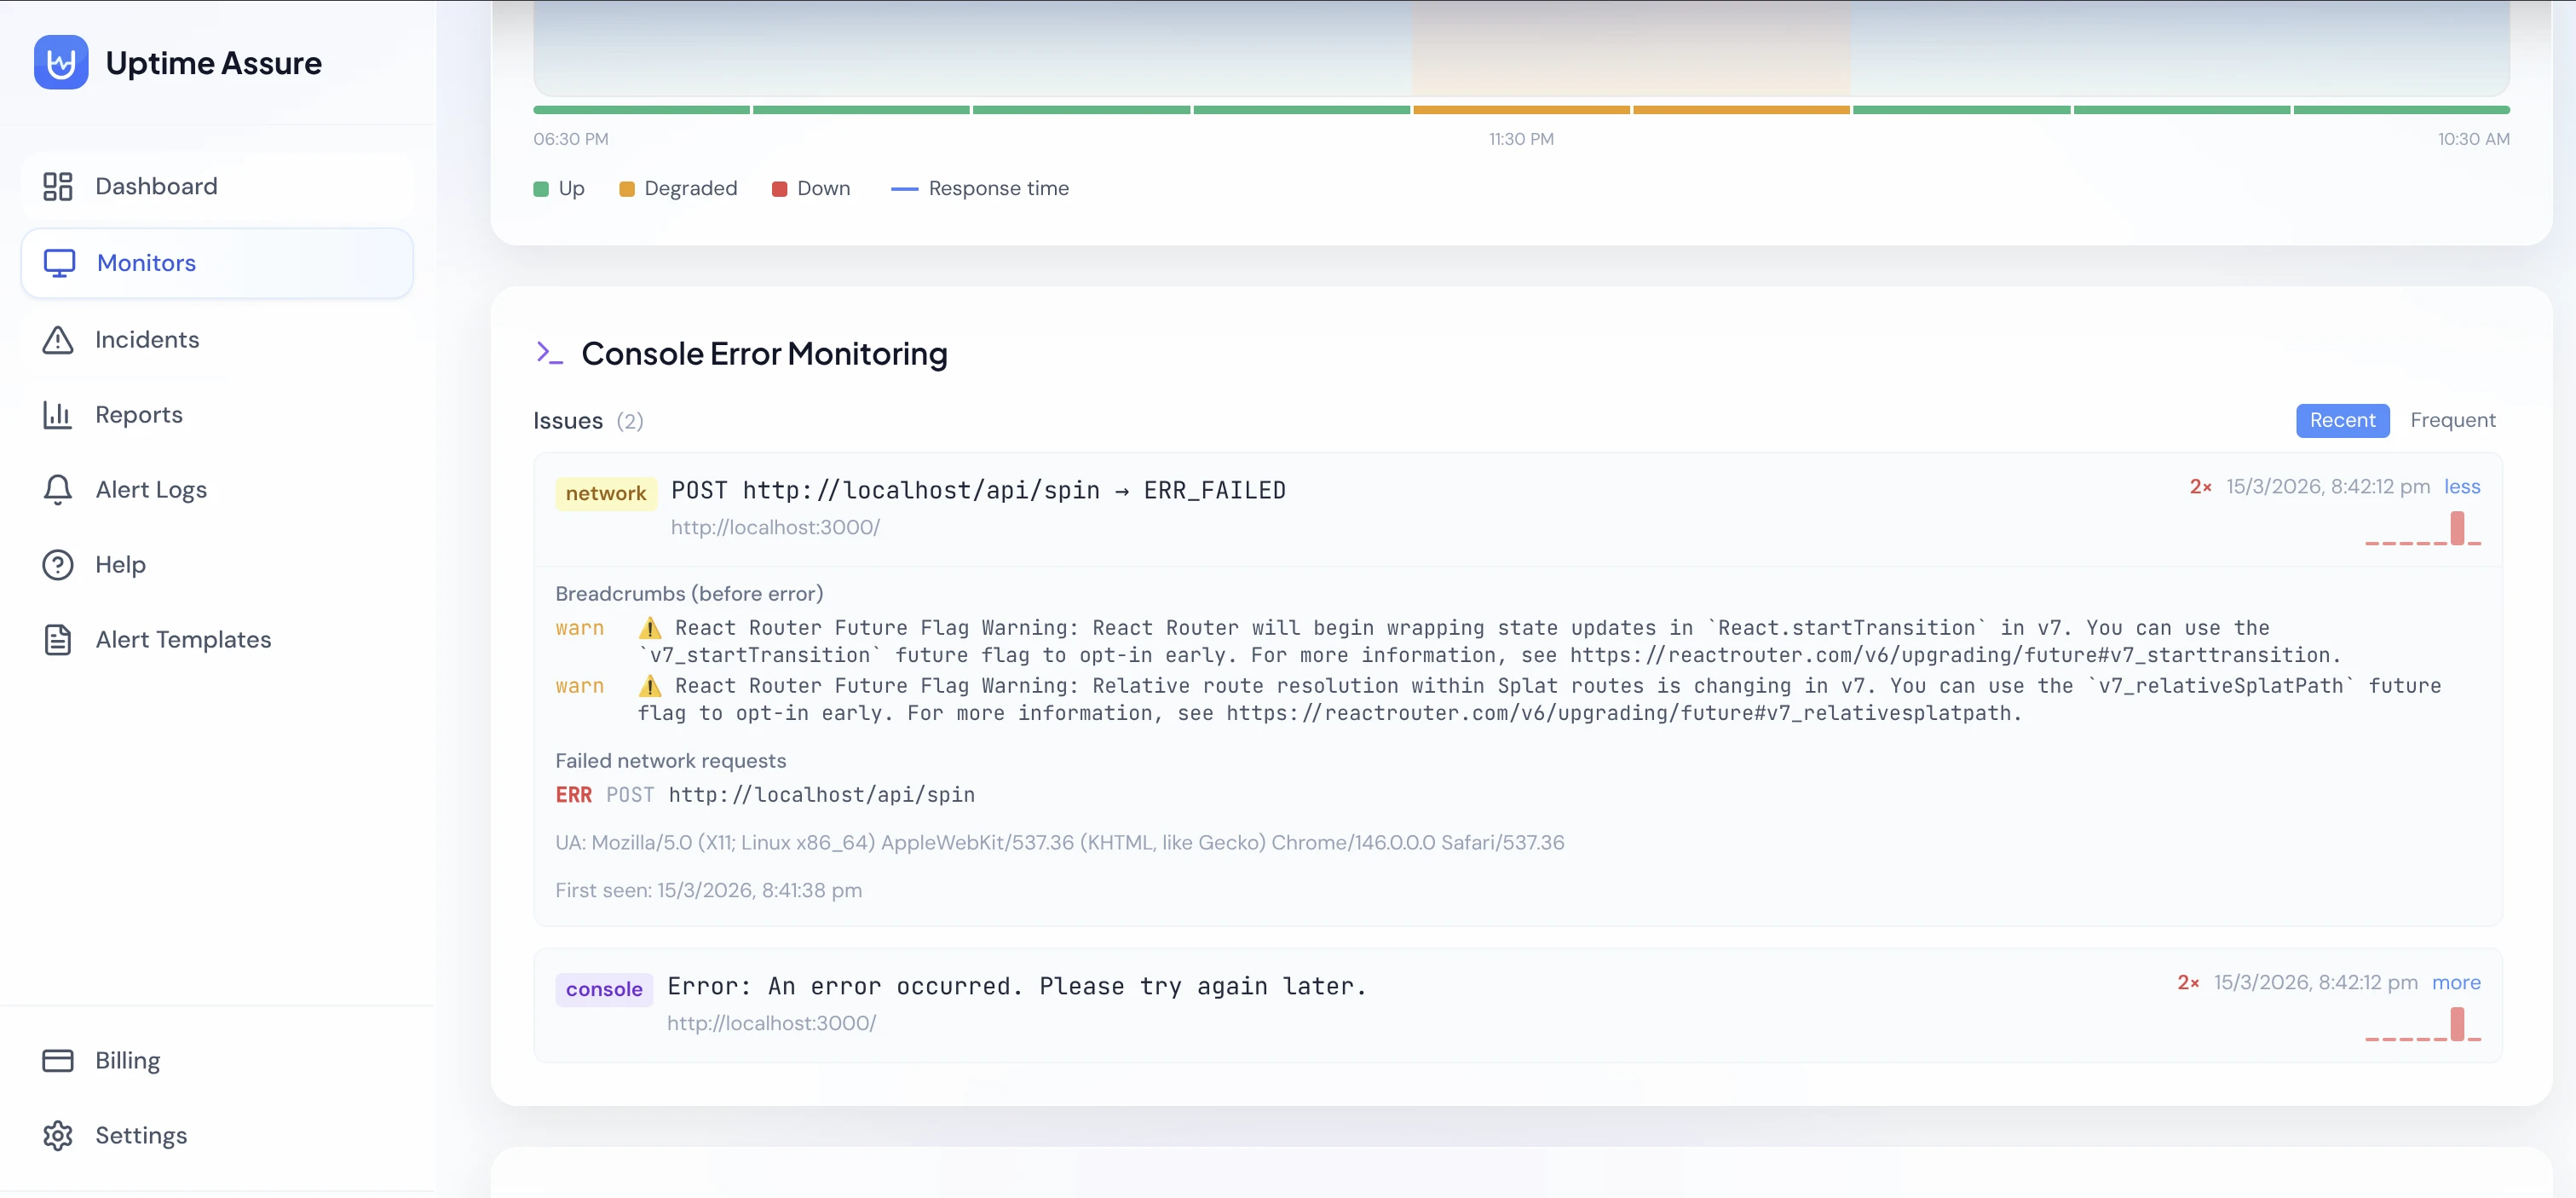
View errors on the monitor detail page
A dedicated Console Errors card shows each captured error with type, message, source file, and timestamp. Grouped errors show frequency trends over time.
Explore more features
Everything you need to keep your services reliable.
Uptime Monitoring
Uptime Assure checks your websites, APIs, and servers every few minutes. The moment something breaks, you're the first to know — before your users ever notice.
Incident Management
Uptime Assure automatically opens and closes incidents as your monitors go down and recover. Track duration, root cause, and history — all in one place.
Real-time Alerts
Instant Email, Slack, and WhatsApp alerts whenever a monitor goes down or comes back up. Customise the message with your own templates and dynamic placeholders.
Start monitoring for free
5 monitors, email + WhatsApp alerts, no credit card required.