Spot slowdowns before your users notice
Track response time for every check, visualise trends across hours to years, and catch performance regressions before they turn into incidents.
Everything you need
Purpose-built features that make performance monitoring reliable, fast, and easy to act on.
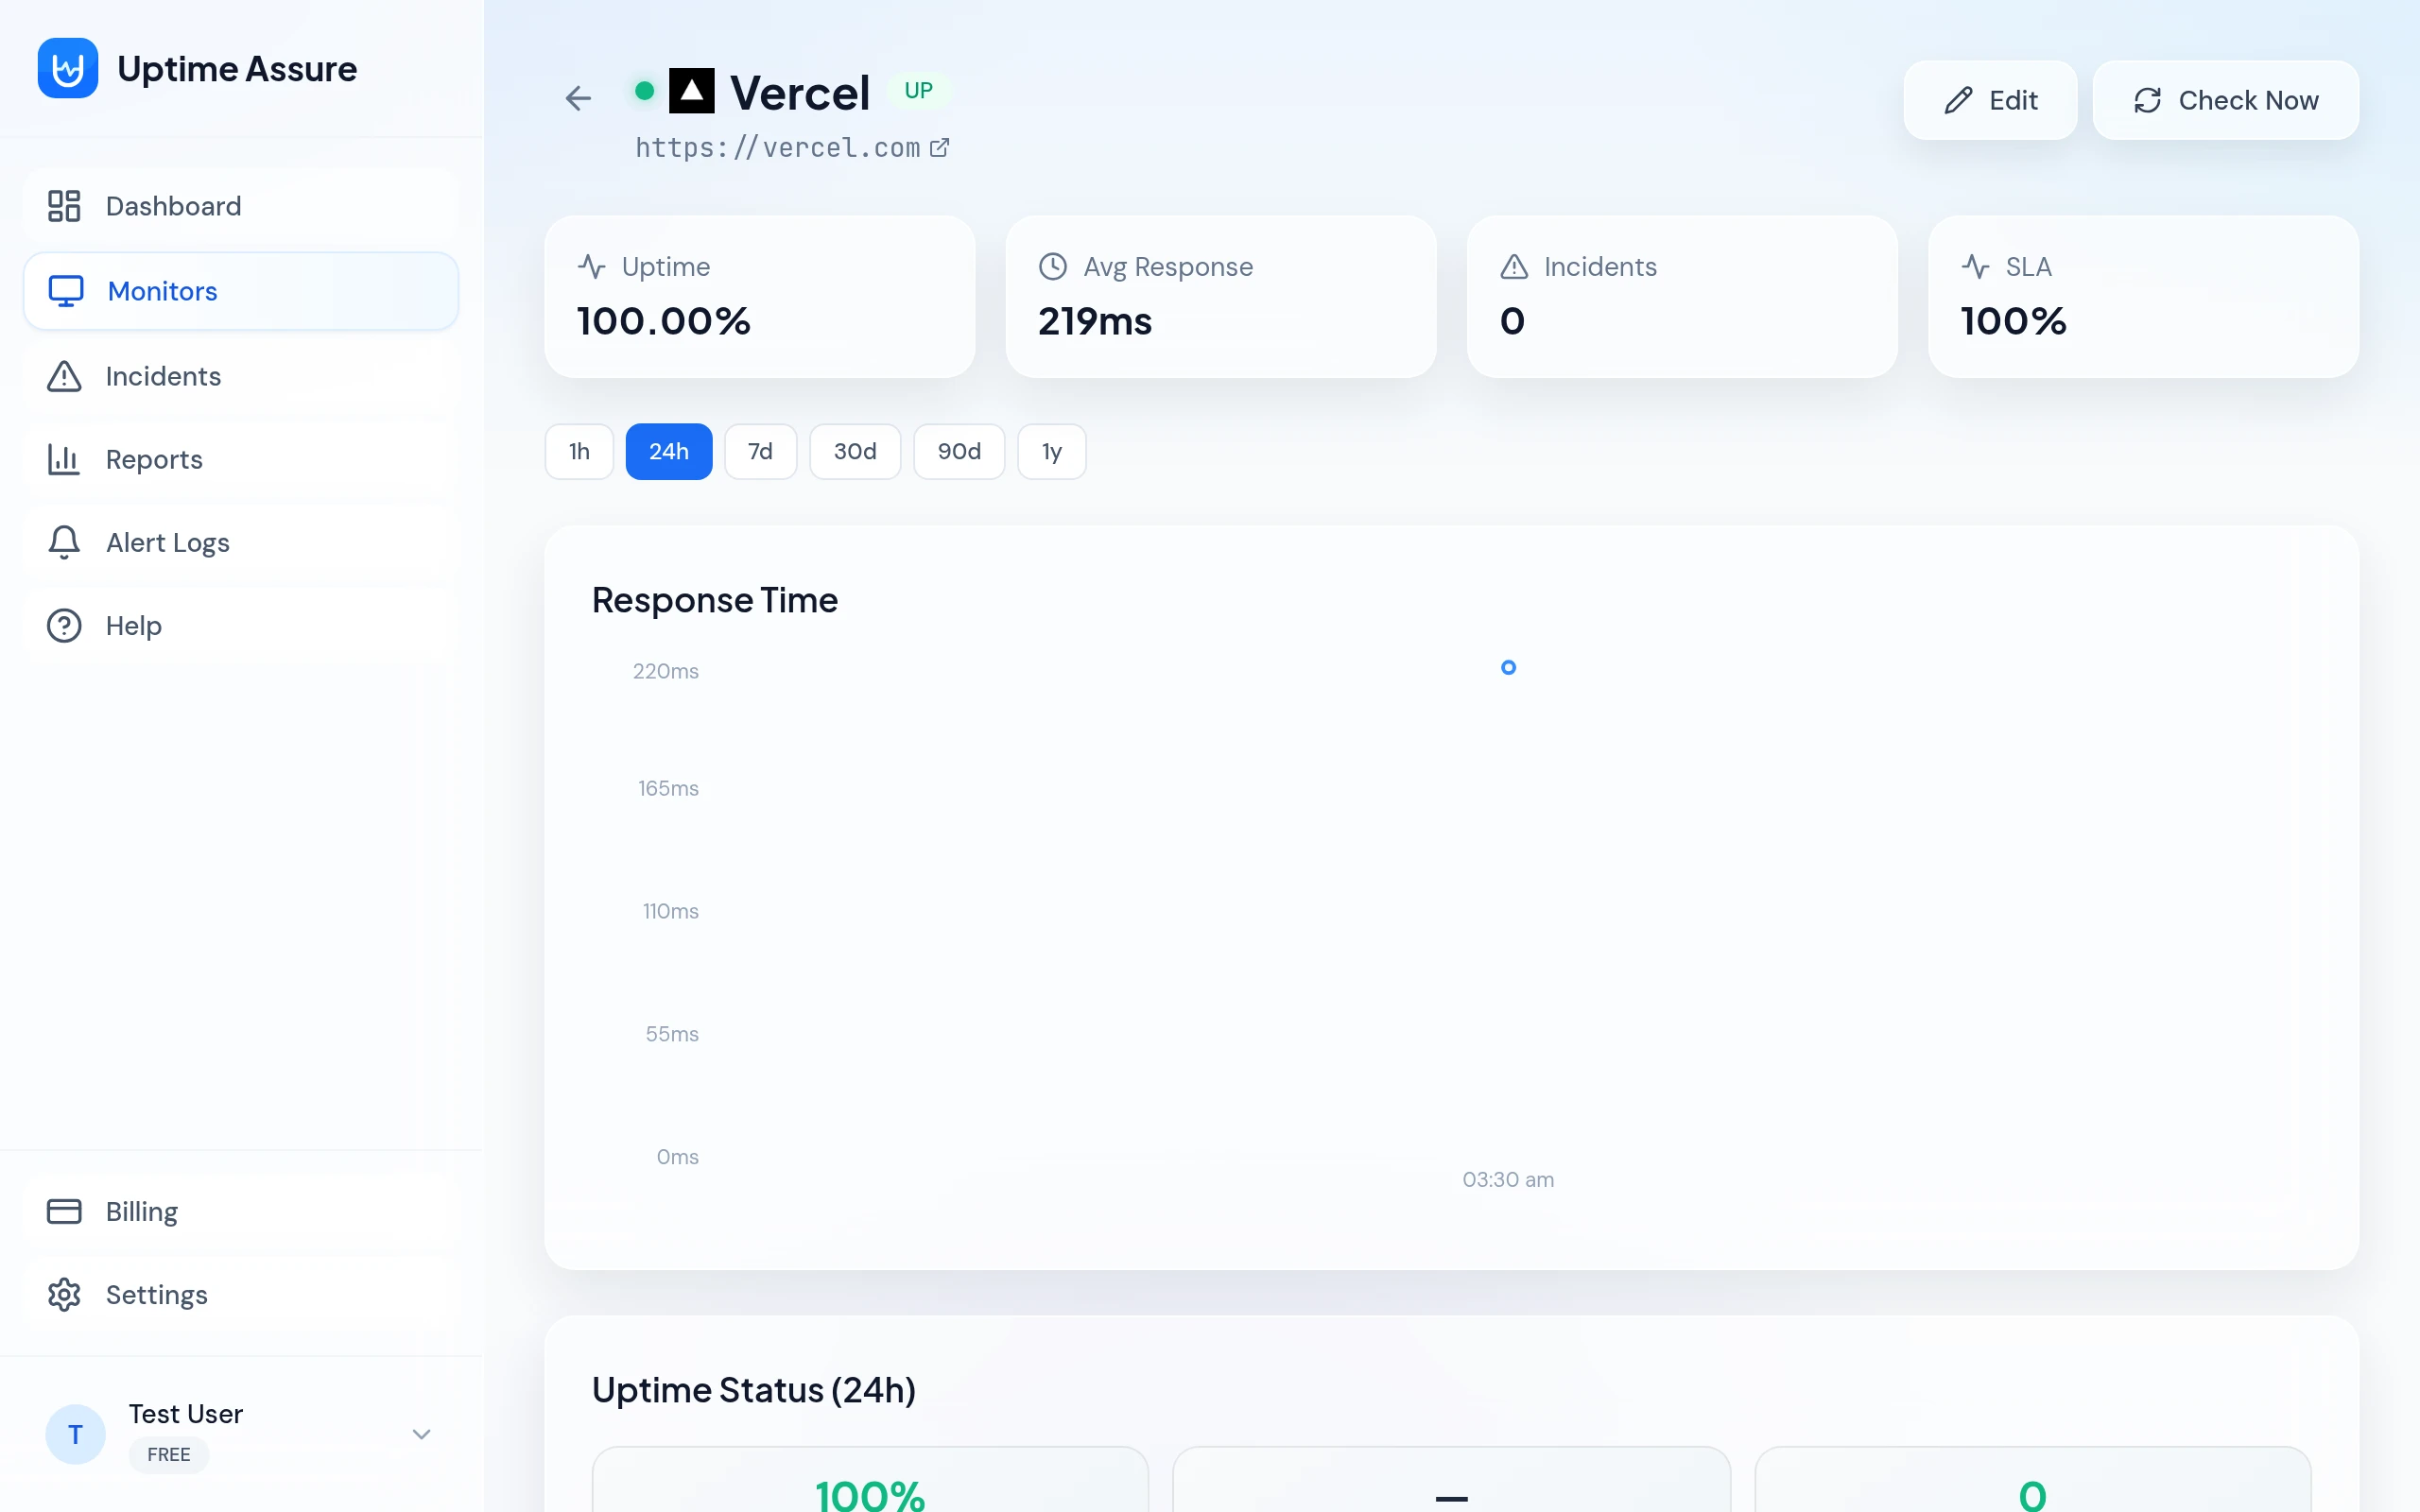
Response time charts
Interactive charts showing response time for every check — across 1h, 24h, 7d, 30d, 90d, and 1y windows.
SLA tracking
SLA percentage calculated per monitor, per period. Know at a glance whether you're meeting your targets.
Uptime breakdown
See uptime %, avg response time, and incident count in a single view — across any time range you choose.
Per-check granularity
Zoom in on individual checks to inspect exact response times, HTTP status codes, and recorded error messages.
How it works
Up and running in 60 seconds — no code required.
Every check is recorded
Response time, status code, and headers are captured on every single check — not just on failures.
View trends over time
Switch between time windows from 1 hour to 1 year to spot patterns, spikes, and gradual degradation.
Act before users are impacted
Use real-time alerts for outages and performance data to proactively identify and fix slow endpoints.
Explore more features
Everything you need to keep your services reliable.
Uptime Monitoring
Uptime Assure checks your websites, APIs, and servers every few minutes. The moment something breaks, you're the first to know — before your users ever notice.
Incident Management
Uptime Assure automatically opens and closes incidents as your monitors go down and recover. Track duration, root cause, and history — all in one place.
Real-time Alerts
Instant Email, Slack, and WhatsApp alerts whenever a monitor goes down or comes back up. Customise the message with your own templates and dynamic placeholders.
Start monitoring for free
5 monitors, email + WhatsApp alerts, no credit card required.